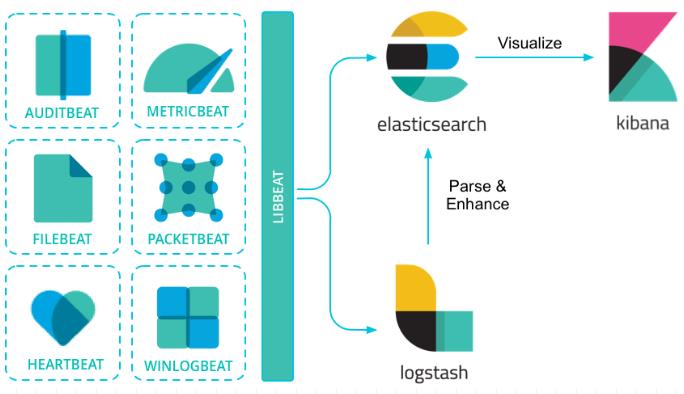
1. ElasticStack 的组成
- **
Beats**:数据采集
LogStash: 数据处理ElasticSearch(核心引擎): 数据存储、查询和分析Kibana: 数据探索与可视化分析
2. Filebeat
Filebeat是本地文件的轻量型日志数据采集器。
Beats可以直接(或者通过Logstash)将数据发送到Elasticsearch,在那里你可以进一步处理和增强数据,然后在Kibana中将其可视化。
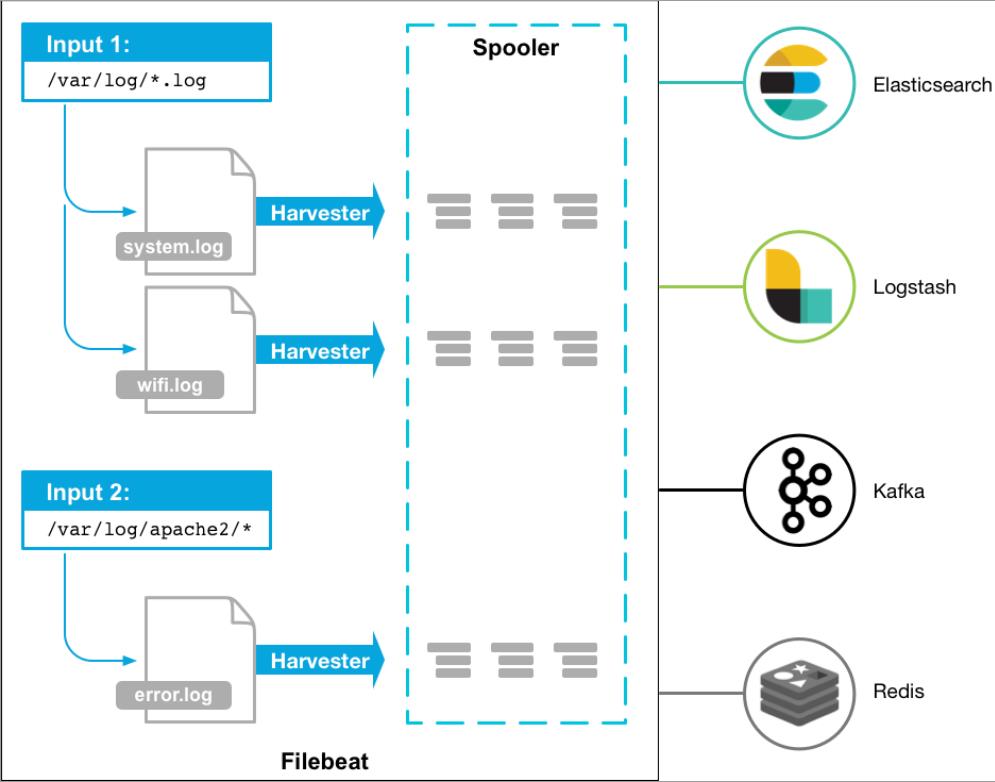
2.1 Filebeat 工作原理
Filebeat 由两个主要组件组成:prospector和harvester。这些组件一起工作来读取文件(tail file)并将事件数据发送到您指定的输出
- **
Harvester**:
- 负责读取单个文件的内容
- 如果文件在读取时被删除或重命名,
Filebeat将继续读取文件
- **
prospector**:
prospector负责**管理harvester**并找到所有要读取的文件来源- 如果输入类型为日志,则查找器将查找路径匹配的所有文件,并为每个文件启动一个
harvester
Filebeat目前支持两种prospector类型:log和stdin
Filebeat如何保持文件的状态
Filebeat 保存每个文件的状态并经常将状态刷新到磁盘上的注册文件中- 该状态用于记住
harvester正在读取的最后偏移量,并确保发送所有日志行
- 如果输出(例如
Elasticsearch或Logstash)无法访问,Filebeat会跟踪最后发送的行,并在输出再次可用时继续读取文件。
- 在
Filebeat运行时,每个prospector内存中也会保存的文件状态信息,当重新启动Filebeat时,将使用注册文件的数据来重建文件状态,Filebeat将每个harvester在从保存的最后偏移量继续读取
Filebeat存储唯一标识符以检测文件是否先前已采集过
Filebeat如何确保至少一次交付
Filebeat保证事件至少会被传送到配置的输出一次,并且不会丢失数据。 Filebeat能够实现此行为,因为它将每个事件的传递状态存储在注册文件中。- 在输出阻塞或未确认所有事件的情况下,
Filebeat将继续尝试发送事件,直到接收端确认已收到。
- 如果
Filebeat在发送事件的过程中关闭,它不会等待输出确认所有收到事件。
- 发送到输出但在
Filebeat关闭前未确认的任何事件在重新启动Filebeat时会再次发送。
- 这可以确保每个事件至少发送一次,但最终会将重复事件发送到输出。
- 也可以通过设置
shutdown_timeout选项来配置Filebeat以在关闭之前等待特定时间
2.2 Filebeat 安装与配置
安装Filebeat,创建配置文件itcast.yml,控制台运行测试
1
2
3
4
5
6
7
8
9
10
|
filebeat.inputs:
- type: stdin
enabled: true
output.console:
pretty: true
enable: true
./filebeat -e -c itcast.yml
|
输入 hello 运行结果如下:
1
2
3
4
5
6
7
8
9
10
11
12
13
14
15
16
17
18
19
20
21
22
23
24
25
26
| hello
{
"@timestamp": "2019-11-23T09:21:19.213Z",
"@metadata": {
"beat": "filebeat",
"type": "_doc",
"version": "7.4.2"
},
"host": {
"name": "chaooo"
},
"agent": { },
"log": {
"offset": 0,
"file": {
"path": ""
}
},
"message": "hello",
"input": {
"type": "stdin"
},
"ecs": {
"version": "1.1.0"
}
}
|
2.3 读取文件
创建配置文件itcast-log.yml
1
2
3
4
5
6
7
8
9
10
| filebeat.inputs:
- type: log
enabled: true
paths:
- /test/*.log
output.console:
pretty: true
enable: true
./filebeat -e -c itcast-log.yml
|
在/test/下创建a.log文件,并输入如下内容hello world,观察filebeat输出:
1
2
3
4
5
6
7
8
9
10
11
12
13
14
15
16
17
18
19
20
21
22
23
24
25
26
27
28
29
30
31
32
33
34
35
36
37
38
39
40
41
42
43
44
45
46
47
48
49
50
| {
"@timestamp": "2019-11-23T09:45:56.379Z",
"@metadata": {
"beat": "filebeat",
"type": "_doc",
"version": "7.4.2"
},
"log": {
"offset": 0,
"file": {
"path": "/test/a.log"
}
},
"message": "hello",
"input": {
"type": "log"
},
"ecs": {
"version": "1.1.0"
},
"host": {
"name": "chaooo"
},
"agent": { }
}
{
"@timestamp": "2019-11-23T09:45:56.379Z",
"@metadata": {
"beat": "filebeat",
"type": "_doc",
"version": "7.4.2"
},
"host": {
"name": "chaooo"
},
"agent": { },
"log": {
"file": {
"path": "/test/a.log"
},
"offset": 7
},
"message": "world",
"input": {
"type": "log"
},
"ecs": {
"version": "1.1.0"
}
}
|
2.4 自定义字段
1
2
3
4
5
6
7
8
9
10
11
12
| filebeat.inputs:
- type: log
enabled: true
paths:
- /test/*.log
tags: ["web"]
fields:
from: itcast-im
fields_under_root: true
output.console:
pretty: true
enable: true
|
2.5 输出到 Elasticsearch
1
2
3
4
5
6
7
8
9
10
11
12
13
| filebeat.inputs:
- type: log
enabled: true
paths:
- /test/*.log
tags: ["web"]
fields:
from: itcast-im
fields_under_root: false
setup.template.settings:
index.number_of_shards: 3
output.elasticsearch:
hosts: ["192.168.1.7:9200","192.168.1.7:9201","192.168.1.7:9202"]
|
2.6 读取 Nginx 日志文件
1
2
3
4
5
6
7
8
9
10
| filebeat.inputs:
- type: log
enabled: true
paths:
- /usr/local/nginx/logs/*.log
tags: ["nginx"]
setup.template.settings:
index.number_of_shards: 3
output.elasticsearch:
hosts: ["192.168.1.7:9200","192.168.1.7:9201","192.168.1.7:9202"]
|
2.7 Filebeat 的 Module
日志数据的读取与处理可以不用手动配置的,在Filebeat中,有大量的Module,可以直接使用简化配置。
1
2
3
4
5
6
7
8
9
10
11
12
13
14
15
16
17
18
19
20
21
22
23
24
25
26
27
28
29
30
31
32
33
34
35
36
37
| ./filebeat modules list
Enabled:
Disabled:
apache
auditd
aws
cef
cisco
coredns
elasticsearch
envoyproxy
googlecloud
haproxy
ibmmq
icinga
iis
iptables
kafka
kibana
logstash
mongodb
mssql
mysql
nats
netflow
nginx
osquery
panw
postgresql
rabbitmq
redis
santa
suricata
system
traefik
zeek
|
可以看到,内置了很多的module,但都没有启用,如果需要启用需要进行enable操作:
1
2
| /filebeat modules enable nginx
./filebeat modules disable nginx
|
2.8 nginx module 与 filebeat 配置
1
2
3
4
5
6
7
| - module: nginx
access:
enabled: true
var.paths: ["/usr/local/nginx/logs/access.log*"]
error:
enabled: true
var.paths: ["/usr/local/nginx/logs/error.log*"]
|
1
2
3
4
5
6
7
8
9
10
11
12
13
14
|
filebeat.inputs:
setup.template.settings:
index.number_of_shards: 3
output.elasticsearch:
hosts: ["192.168.40.133:9200","192.168.40.134:9200","192.168.40.135:9200"]
filebeat.config.modules:
path: ${path.config}/modules.d/*.yml
reload.enabled: false
|
若启动报错,需要在Elasticsearch中安装ingest-user-agent、ingest-geoip插件
3. Metricbeat
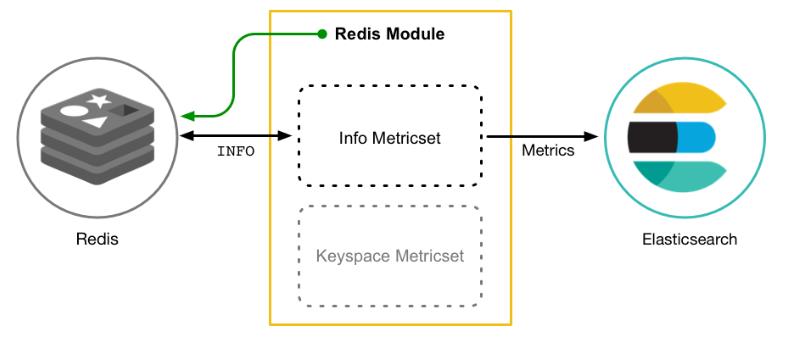
用于从系统和服务收集指标。Metricbeat和Filebeat一样,是一个轻量级的采集器,Metricbeat由模块(Module)和度量集(Metricset)组成。Metricbeat模块定义了从特定服务(如 Redis,MySQL 等)收集数据的基本逻辑。该模块指定有关服务的详细信息,包括如何连接,收集指标的频率以及要收集的指标。
Metricbeat有 2 部分组成,一部分是Module,另一部分为Metricset。Module
- 收集的对象,如:
mysql、redis、nginx、操作系统等;
Metricset
- 收集指标的集合,如:
cpu、memory、network等;
- 以
Redis Module为例:
3.1 安装配置
安装 Metricbeat,根据实际情况配置文件metricbeat.yml
1
2
3
4
5
6
7
8
9
| metricbeat.config.modules:
path: ${path.config}/modules.d/*.yml
reload.enabled: false
setup.kibana:
host: "192.168.56.13:5601"
output.elasticsearch:
hosts: ["192.168.56.13:9200"]
username: "elastic"
password: "qiuyuetao"
|
启动:./metricbeat -e
查看module列表:./metricbeat modules list
1
2
3
4
5
6
7
8
9
10
| Enabled:
system
Disabled:
apache
elasticsearch
nginx
mysql
redis
...
|
system module默认启用的,其配置:
1
2
3
4
5
6
7
8
9
10
11
12
13
14
15
16
17
18
19
20
21
22
23
24
25
26
27
28
29
30
| cat system.yml
- module: system
period: 10s
metricsets:
- cpu
- load
- memory
- network
- process
- process_summary
process.include_top_n:
by_cpu: 5
by_memory: 5
- module: system
period: 1m
metricsets:
- filesystem
- fsstat
processors:
- drop_event.when.regexp:
system.filesystem.mount_point: '^/(sys|cgroup|proc|dev|etc|host|lib)($|/)'
- module: system
period: 15m
metricsets:
- uptime
|
3.2 Nginx Module
在 nginx 中,需要开启状态查询,才能查询到指标数据。
1
2
3
4
5
|
location /nginx-status {
stub_status on;
access_log off;
}
|
- 通过
192.168.56.13/nginx-status查看nginx-status
Active connections:正在处理的活动连接数server accepts handled requests(连接数,握手数,处理请求总数)Reading: 0 Writing: 1 Waiting: 1( 读取到客户端的 Header 信息数,返回给客户端 Header 信息数,已经处理完正在等候下一次请求指令的驻留链接)
配置Nginx Module(metricbeat/modules.d/nginx.yml)
1
2
3
4
5
6
7
| - module: nginx
metricsets: ["stubstatus"]
period: 10s
hosts: ["http://192.168.56.11"]
server_status_path: "nginx_status"
|
启动:./metricbeat -e
4. Logstash
Logstash是ElasticStack中的实时数据采集引擎,可以采集来自不同数据源的数据,并对数据进行处理后输出到多种输出源,是Elastic Stack的重要组成部分。
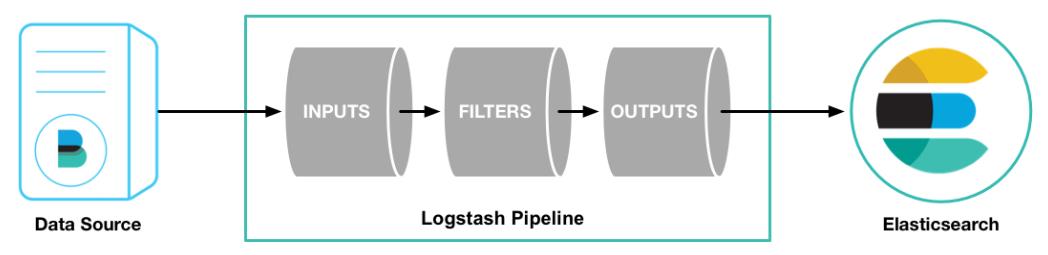
4.1 Logstash 的数据处理过程
Inputs(Codecs)-->Filters-->Outputs(Codecs)
- 用户通过定义
pipeline配置文件,设置需要使用的input,filter,output, codec插件,以实现特定的数据采集,数据处理,数据输出等功能
Inputs:用于从数据源获取数据,常见的插件如file, syslog, redis, beats等Filters:用于处理数据如格式转换,数据派生等,常见的插件如grok, mutate, drop, clone, geoip等Outputs:用于数据输出,常见的插件如elastcisearch,file, graphite, statsd等Codecs:Codecs不是一个单独的流程,而是在输入和输出等插件中用于数据转换的模块,用于对数据进行编码处理,常见的插件如json,multiline
4.2 执行模型
- 每个
Input启动一个线程,从对应数据源获取数据
Input会将数据写入一个队列:默认为内存中的有界队列(意外停止会导致数据丢失)。为了防止数丢失Logstash提供了两个特性:
Persistent Queues:通过磁盘上的queue来防止数据丢失Dead Letter Queues:保存无法处理的event(仅支持Elasticsearch作为输出源)
Logstash会有多个pipeline worker, 每一个pipeline worker会从队列中取一批数据,然后执行filter和output(worker数目及每次处理的数据量均由配置确定)
4.3 安装配置
下载Logstash并解压,配置有三部分,如下:
1
2
3
4
5
6
7
8
9
| input {
stdin { ... }
}
filter {
...
}
output {
stdout { ... }
}
|
4.4 读取自定义日志
- 日志结构:
2019-11-23 21:21:21|ERROR|读取数据出错|参数:id=1002,日志中的内容是使用“|”进行分割的,使用,我们在处理的时候,也需要对数据做分割处理。
- 编写配置文件
1
2
3
4
5
6
7
8
9
10
11
12
13
14
15
|
input {
file {
path => "/itcast/logstash/logs/app.log"
start_position => "beginning"
}
}
filter {
mutate {
split => {"message"=>"|"}
}
}
output {
stdout { codec => rubydebug }
}
|
- 启动测试
1
2
3
4
5
6
7
8
9
10
11
12
13
14
15
16
17
|
./bin/logstash -f ./itcast-pipeline.conf
echo "2019-11-23 21:21:21|ERROR|读取数据出错|参数:id=1002" >> app.log
{
"@timestamp" => 2019-03-15T08:44:04.749Z,
"path" => "/itcast/logstash/logs/app.log",
"@version" => "1",
"host" => "node01",
"message" => [
[0] "2019-11-23 21:21:21",
[1] "ERROR",
[2] "读取数据出错",
[3] "参数:id=1002"
]
}
|
- 输出到
Elasticsearch配置
1
2
3
4
5
| output {
elasticsearch {
hosts => [ "192.168.40.133:9200","192.168.40.134:9200","192.168.40.135:9200"]
}
}
|
5. Elasticsearch + Logstash + Beats + Kibana 基础整合
1
2
3
| (读取) (发送) (写入) (读取)
「日志文件」<----「FileBeat」---->「Logstash」---->「Elasticsearch」<----「Kibana」
|
Filebeat配置与启动:
1
2
3
4
5
6
7
8
9
10
11
12
13
|
filebeat.inputs:
- type: log
enabled: true
paths:
- /itcast/logs/*.log
setup.template.settings:
index.number_of_shards: 3
output.logstash:
hosts: ["192.168.40.133:5044"]
./filebeat -e -c itcast-dashboard.yml
|
Logstash配置与启动:
1
2
3
4
5
6
7
8
9
10
11
12
13
14
15
16
17
18
19
20
21
22
23
24
25
26
27
28
29
30
31
32
33
|
input {
beats {
port => "5044"
}
}
filter {
mutate {
split => {"message"=>"|"}
}
mutate {
add_field => {
"userId" => "%{message[1]}"
"visit" => "%{message[2]}"
"date" => "%{message[3]}"
}
}
mutate {
convert => {
"userId" => "integer"
"visit" => "string"
"date" => "string"
}
}
}
output {
  elasticsearch {
    hosts => [ "192.168.40.133:9200","192.168.40.134:9200","192.168.40.135:9200"]
  }
}
./bin/logstash -f itcast-dashboard.conf
|
ElasticSearch启动与Kibana启动:
1
2
3
4
5
6
|
bin/elasticsearch
bin/kibana
http://192.168.40.133:5601
|
原文链接: http://chaooo.github.io/2018/11/28/elastic-stack.html
版权声明: 转载请注明出处.